Document Type : Original Article
Authors
1 Ph.D. Candidate in Financial engineering, Faculty of Economic, Management and Accounting, Yazd University, Yazd, Iran.
2 MSc. in finance, Faculty of Economic, Management and Accounting, Yazd University, Yazd, Iran.
3 Department of Accounting and Finance, Faculty of Humanities and Social Sciences, Yazd University, Yazd, Iran.
Keywords
Introduction
Data mining is introduced as the data analysis science to gain insight and knowledge about the data under study. Researchers in most scientific fields such as management, economics, medical sciences, engineering, and biology have faced the crisis of rapid growth of information and the existence of high-dimensional data that, using this method, seeks to understand the relationships between existing phenomena (Williams, 2011).
Clustering is introduced as critical data mining method to extract useful information from different data sets in high dimensions (Kumar & Wasan, 2010). In other words, clustering is a process of grouping objects in clusters, so that objects in a cluster are pretty similar and different in comparison with objects in other clusters (Chaudhuri & Ghosh, 2016) and (Jain & Dubes, 1988) in recent years, different kinds of clustering methods have been proposed and developed, These methods can be defined and designed as a mathematical technique to reveal the classification structures in data collection of real-world phenomena (Al-Augby et al., 2014).
One of the most critical investment issues facing different investors is choosing an optimal investment portfolio and balancing risk and return, this portfolio should maximise investment returns and minimize the investment risk (Kolm et al., 2014). "Portfolio Selection" by Markowitz (1952), presented the portfolio analysis theory for the first time; This theory was used by investors and financial institutions for a long time (Pardalos et al., 1994). In the following years, some mathematical approaches were used in financial decisions (Detemple, 2014).
Today, with the expansion of the capital market, a large amount of information has been encountered, this information should be organized and simplified, and also standardized to be the basis of investors' decisions. Therefore, clustering stock exchange companies based on similar characteristics can help investors and analysts to achieve this goal.
In this research, the Clustering and existing techniques for Clustering are introduced first, and then using three methods of K-Means clustering, Hierarchical Clustering, and Affinity Propagation Clustering, after that, in order to visualise finely selected share pairs, using the t-SNE Clustering method.
Literature Review
Clustering is one of the most critical tasks of data mining and one of the types of unsupervised learning models, the goal of this method is grouping naturally a set of objects and data in different sections, and then the quantitative comparison of the characteristics of each section allows the discovery and investigation of hidden structures in the data (Jain, 2010). Time series data clustering is usually used to discover patterns in time series sets (Wang et al., 2002).
This task is divided into two separate sections, the first part consists of finding patterns that Frequently occur in time series (Chung et al., 2001), (Chiu et al., 2003), and the second part is methods that explore patterns that rarely occur in time series.
It also explores events that have surprising effects on the process of time series (Keogh et al., 2002), (Leng et al., 2009). Clustering categorizes data by reducing the volume of data and finding patterns.
The general approaches of clustering algorithms are as in Figure (1).
|
|
|
Figure 1. Types of clustering algorithms (Saxena et al., 2017) |
Types of Clustering Algorithms (Saxena et al., 2017)
Clustering is divided into two categories partial and hierarchical, each of which is defined and categorized below:
They are dividing data sets into non-overlapping subsets so that each data is located in exactly one subset.
2.1 Agglomerative methods (bottom to the top method)
Starts each data in a cluster. Repetitively, it combines clusters close together at each stage to remain a cluster eventually.
2.2 Divisible methods (top to the bottomed method)
Starts the whole data as a cluster. Repetitively, it splits the data into one of the clusters until it is only one data per cluster.
In this study, four methods (k-means Clustering methods, Hierarchical Clustering, Affinity Propagation Clustering, and t-SNE) will be explained in detail.
There are many different types of clustering techniques that vary according to strategy and identifying categorizations. The choice of which technique should be applied depends on the nature and structure of the data. In this section, three Clustering methods will be discussed:
The following is a summary of these clustering methods, including their strengths and weaknesses. Additional details for each clustering method are provided in case studies.
K-Means is the most famous Clustering method by JB. MacQueen suggested in 1967 that this method be used as a classical Clustering algorithm in scientific research and industrial applications. The purpose of the k-means algorithm is to find and group data points in similar classes, and this similarity is perceived as the opposite point of the distance between the data, in fact, the closer the data points are, the more likely they are to belong to a cluster. The main idea of this algorithm is to divide nth data objects into nth clusters so that the sum of the squares of the data points in each cluster is the smallest to the center of the cluster (Thuraisingham & Ceruti, 2000).
The algorithm finds the center of "k" and assigns each data point to exactly one cluster to minimize the variance within the cluster (called inertia). This method usually uses Euclidean distance (the typical distance between two points), but other distance criteria can be used. The k-means algorithm offers a local optimal for a given K and acts as follows:
4- Cluster centers are updated to the average allocation.
5- Step 3-4 is repeated until all cluster centers remain unchanged.
In other words, it randomly moves around a certain number of mass centers per iteration, and each data point is assigned to the nearest mass center (Tatsat et al., 2020).
During these steps, calculate the average distance of all points in each center. Then, when the minimum distance from data points to their respective mass centers appeared, clusters are specified.
The meta-parameters of k-means are:
The number of clusters.
The number of clusters and mass centers (centroids) for production.
Maximum repetitions.
Maximum algorithm iterations for a single run.
Primary Number.
The number of times the algorithm will run with different mass centers. The final result will be the best output of the number of consecutive performances defined in inertia.
With K-Means, different random starting points for cluster centers often lead to very different Clustering solutions, so the k-means algorithm is implemented in learning with at least ten random initial values, and the solution with the highest number of times is chosen.
K-Means strengths include simplicity, a wide range of applications, rapid convergence, and linear scalability of big data while producing uniform size clusters.
When the exact number of clusters is already known as K, it is most beneficial. The main weakness of k-means is that this parameter must be adjusted. Other drawbacks include the lack of guarantees for finding a global optimal and its sensitivity to outliers data(Tatsat et al., 2020).
Hierarchical clustering involves creating clusters that have a dominant order from top to bottom. The main advantage of hierarchical clustering is that there is no need to determine the number of clusters. The model itself determines that and solves this problem. This clustering method is divided into two types agglomerative hierarchical Clustering and divisive hierarchical Clustering.
Agglomerative hierarchical Clustering is the most common type of hierarchical Clustering used to group objects based on similarity. Agglomerative hierarchical Clustering is a "bottom-up" approach where each observation starts in its cluster while moving towards the top of the hierarchy, the pairs of clusters merge. The agglomerative hierarchical Clustering algorithm offers a local optimum that works as follows:
Divisive hierarchical Clustering acts "top-down" and respectively separates the remaining Clusters to produce distinct subgroups, respectively.
Both methods create the N-1 hierarchical level and facilitate clustering at the level that divides the data best into homogeneous groups.
Hierarchical Clustering enables the drawing of dendrograms, a picture of a binary hierarchical Clustering. A dendrogram is a tree diagram that shows hierarchical relationships between different data sets. Dendrograms provide an exciting and informative embodiment of hierarchical clustering results that include the memory of the hierarchical Clustering algorithm, so it is possible to express how cluster formation is formed simply by examining the diagram.
One of the advantages of hierarchical Clustering is that it is easy to implement, there is no need to specify the number of clusters, and the dendrograms it produces are very useful for understanding data. However, temporal complexity in hierarchical clustering can lead to longer calculation times than other algorithms, such as K-Means. If a large data set is desired, it will be challenging to determine the correct number of clusters by observing the dendrogram. Hierarchical clustering is very sensitive to outliers data, and in their presence, the model's performance is significantly reduced (Tatsat et al., 2020).
Affinity propagation creates clusters by sending messages between data points to convergence. Although clustering algorithms such as K-Means require the number of clusters, affinity propagation does not require the number of clusters to be determined or estimated before the algorithm is implemented. Two critical parameters used in Affinity propagation to determine the number of clusters include priority, which controls the number of samples (prototypes), and the damping factor that reduces the availability and responsibility of messages to prevent numerical fluctuations when updating these messages.
A dataset is described using a small number of samples. These are members of the input set that represent clusters. The Affinity propagation algorithm includes pairwise similarities between the data points and finds clusters by maximizing the total similarity between the data points and their samples. Messages sent between pairs indicate the suitability of one instance as an example of another one being updated in response to other pairs' values. This update repeatedly occurs to achieve convergence, at which point the final samples are selected, and we obtain the final clustering (Tatsat et al., 2020).
t-distributed Stochastic Neighbor Embedding (t-SNE) is a dimension reduction algorithm that reduces dimensions by modeling the probability distribution of neighbors around each point. Here, the term "neighbors" refers to a set of points close to a specific point. This algorithm emphasizes maintaining similar points in low dimensions versus maintaining the distance between separated points in high dimensions.
The algorithm calculates the probability of similarity between data points in space with corresponding high and low dimensions. The similarity of points is calculated as the conditional probability that point A selects point B as its neighbor. If the neighbors are selected according to their probability density under a normal distribution in center A. The algorithm then tries to minimize the difference between these conditions of possibilities (with similarities) with high and low dimensional spaces to display data points in low dimensional space fully (Tatsat et al., 2020).
Clustering is one of the data mining techniques that groups data based on a similarity criterion without any knowledge about the number and characteristics of groups. Clustering based on similarity in the trend of changes can be very useful for evaluating the prices' co-movement. So far, several kinds of research have been conducted in the field of Clustering and investigating the correlation or convergence between stocks in a stock exchange, the total index or index related to a particular industry in different countries' stock exchanges, or the index of different industries in a stock exchange, which is discussed and presented in the following.
It is not easy to provide a complete list of fields and scientific topics that have used clustering algorithms. For example, Clustering algorithms are used in the division of images, which is one of the most critical issues in machine vision (Jain & Flynn, 1996), documents can be clustered (Iwayama & Tokunaga, 1995), and Clustering can be used to categorize different customers efficient marketing (Arabie, 1994). Clusters are also used to group service partnerships for workforce management and planning. Another comprehensive function of clustering is in biology and genome studies (Baldi & Hatfield, 2011).
In Zheng et al.'s research (2005), different types of clustering were investigated and compared with them, and the advantages of each method were expressed (Zheng et al., 2005).
(Al-Augby et al., 2014) conducted research to compare Clustering methods K-Means and fuzzy methods based on data from banking companies and energy companies in the Persian Gulf Council stock markets. In this study, Clustering algorithms are investigated, and the advantages of each method are explained.
In a 2012 study titled Cluster approach to stock market forecasting, Babu et al. investigated stock market clustering based on the K-Means clustering algorithm, hierarchical clustering algorithm, and reverse K-Means. In this study, using the mentioned methods, stock price movement was predicted to be better in terms of accuracy and efficiency than other supervised learning methods (Babu et al., 2012).
In their research, (Durante et al., 2014) presented a method for clustering financial time series according to their distribution continuity. This method is derived based on the calculation of Spearman correlation coefficients. The results of this study can be used to create a minimum risk financial portfolio.
(Raffinot, 2017) proposes a hierarchical clustering-based asset allocation method that uses network theory and machine learning techniques. Their experimental results show that the portfolio based on hierarchical Clustering is stable and genuinely diverse, and they achieve better performance for risk adjustment than conventional optimization techniques.
A paper published by (Ding et al., 2019) was clustered using the stock K-Means benchmark in the CSI800 index. In this study, hierarchical Clustering diagrams, based on similarity structure diagrams, were drawn and, analyzed and also it was clearly expressed that clustering approaches in the stock analysis have visual characteristics and ease of analysis.
(Nakagawa et al., 2019) In a research, a pattern of stock price fluctuations that were not fully utilized in the financial market was used as a predictive input feature. They extracted the price volatility patterns using the k-Medoids Clustering with Indexing DTW (Dynamic Time Warping) method.
In (Huarng et al., 2008) research study the Structural changes by using the K-Means clustering method to analyze a time series in Taiwan Stock Exchange Capitalization Weighted Stock Index. This study also illustrates the advantages of using the clustering method to determine structural changes.
(Liao et al., 2008) in their research investigate a two-stage data mining method to summarize and visualize the Taiwan stock market data. The first stage involves using a set of methods to illustrate the patterns and rules to propose stock category and then in the second stage, implementing K-Means clustering to mine stock category clusters to give helpful information to investors.
Research Methodology
In the present research, the clustering method used to investigate the movement between the data tested is the clustering approach. The first step in the data preparation process is data mining. Therefore, the adjusted daily data of all listed companies for 01 July 2019 to 29 September 2020 in the Top 50 Index Tehran Stock Exchange for 303 trading days were extracted through NoavaranAmin Innovators software. The second step in the data preparation process is data preprocessing. At the beginning of this step, the data needs to be cleared of noise, out-of-date, and missing data that compromise data quality. In this study, the number of trading days of all stocks was examined, then according to the number of trading days, it remained 48 shares (Shasta and Sita were omitted) and the rest, were removed from the statistical population due to a lack of sufficient trading information.
In this study, the adjusted final price has been used as the primary variable of Clustering. It starts with the Pit raw price series, which shows the stock price of company i on day t, and Pit-1 also shows the stock price of the company i on day t-1. Then the logarithmic returns of the companies' shares are calculated according to equation (1).
|
|
(1) |
To determine the degree of similarity of two-time series, it is necessary to determine time series A can explain how much time series B. This value is determined using the following equation known as the correlation coefficient, which in the original diameter is one, and other elements show their correlation coefficient:
|
(2) |
|
The following equation is used to convert the correlation coefficient to a metric criterion:
|
|
(3) |
After processing the data and in the model learning stage, we seek to achieve the data order. As mentioned earlier in this study, we intend to use the Clustering method as an unsupervised learning method.
Next, to use the K-means Clustering method, it is necessary to calculate the optimal number of clusters.
These two methods help find the number of clusters in k-means:
Based on the Sum of squared errors (SSE) within clusters
Based on the silhouette score
In order to determine the appropriate number of clusters can use the elbow method and also The sum of squared errors is one of the statistical methods and is often used as a research reference in determining optimal clusters. The SSE of each point is the square of the difference between the point from its representation (i.e., its predicted cluster center). The SSE plotted a range of values for the number of clusters. The first cluster will add much information (explain a lot of variances), but eventually, the angle in the graph decrease and the marginal gain will drop. The number of clusters selected at this point; hence it is referred to as the "elbow criterion."(Tatsat et al., 2020),(Nainggolan et al., 2019).
Figure (2) shows the Sum of squared errors (SSE) within clusters.
|
|
|
Figure 2. Sum of squared errors (SSE) within clusters |
Looking at the Sum of squares of error, it seems that 4, the sum of squares of error decreases, and it seems that this number is suitable for the cluster.
Figure (3) presents the silhouette score within clusters.
|
|
|
Figure 3. silhouette score |
Now let us check out the silhouette method. The silhouette score measures the similarity of a point to its cluster (cohesion) in comparison to another cluster (separation). The silhouette value`s range is between +1, and –1. the point is placed in the correct cluster, the higher the value and because of too many or too few created clusters, many points have a negative silhouette value (Tatsat et al., 2020).
According to the results of the two graphs, 4 clusters are considered for the K-Means model.
Figure (4) illustrates the k-means model with seven clusters and visualizes the results.
|
|
|
Figure 4. K-Means clustering |
The graph of the number of shares in each cluster is shown in Figure (5).
|
|
|
Figure 5. Number of shares in each cluster using the K-means method |
The number of stocks per cluster ranges from around 4 to 24. Although the distribution is not equal, we have a significant number of stocks in each cluster.
In the next step, we will cluster in hierarchical clustering. As discussed in the literature review, the main advantage of hierarchical Clustering is that there is no need to determine the number of clusters, and the model alone determines and solves this problem.
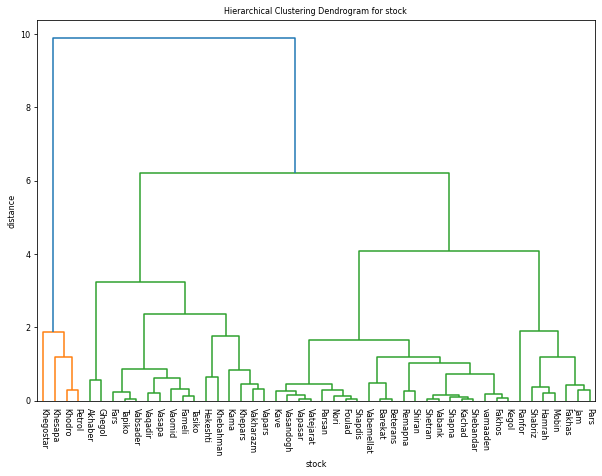
Figure (6) shows the Hierarchical Clustering, a dendrogram of stock clustering based on Euclidean distance.
|
|
|
Figure 6. Hierarchical Clustering, a dendrogram of stock Clustering based on Euclidean distance |
Figure (7) presents the Hierarchical Clustering.
|
|
|
Figure 7. Hierarchical Clustering |
A measure of Cophenetic Correlation Coefficient, c, is a measure of how well the clustering performs. It used the actual pairwise distances of all samples Clustering by the hierarchical clustering and then compared there. If c is closer to 1, the better the clustering preserves the original distances. In general, c > 0.7 is considered a good cluster fit. Of course, other accuracy checks are possible. The calculation results of this criterion are equal to: 0.7805.
Although hierarchical Clustering does not contain hyperparameters like the k-Means method, the measure of dissimilarity between clusters (as contradictory to individual data points) has a fundamental impact on the clustering result. The options differ as follows:
Single-link: minimum the distance between nearest neighbors of two clusters.
Complete link: use the maximum distance between respective cluster members.
Group average: use the average distances of each observation of the cluster.
Ward’s method: minimize the variance within the cluster.
Figure (8) shows the compare different linkage methods.
|
|
|
Figure 8. Compare Different linkage methods |
Table (1) Compare Cophenetic Correlation Coefficient for Different linkage methods.
Table 1. Compare Cophenetic Correlation Coefficient
|
Single-link |
Complete link |
Group average |
Ward’s method |
|
0.87 |
0.45 |
0.89 |
0.78 |
Figure (9) shows the affinity propagation method. This method does not need to determine the number of clusters in advance and does it.
|
|
|
Figure 9. affinity propagation clustering |
Figure (10) shows the number of clusters using the affinity propagation Clustering method. As can be seen, the number of clusters in this method is equal to 8.
|
|
|
Figure 10. Estimation of the number of clusters using the affinity propagation Clustering method. |
Figure (11) illustrates the number of shares in the cluster using the affinity propagation Clustering method.
|
|
|
Figure 11. Number of shares in each cluster by affinity propagation Clustering method |
Data analysis is useful in order to answer research questions; therefore, it is one of the primary and most essential parts of all research. Therefore, information analysis can be mentioned as an integral part of scientific research in order to answer the problems and also to confirm or reject the research hypotheses. We will first discuss which of the various clustering methods is the best. The silhouette coefficient in sklearn. metrics. sil houette_score can be used to evaluate clustering results. A higher silhouette coefficient indicates a model with better clusters. In order to gain this goal, we can use the sklearn library and the Python metrics criterion, the three mentioned Clustering methods are evaluated. The evaluation results are in Table (2).
Table 2. Cluster evaluation
|
0.422 |
K-Means Clustering |
|
0.376 |
Hierarchical Clustering |
|
0.345 |
Affinity Propagation |
According to the evaluation results, the K-Means Clustering method is a better criterion for stock clustering.
The next step is to examine whether clustering results can lead to sound output and identify quotas with similar characteristics. For this purpose, we select a date and show the movement's results for the yield behavior of 4 clusters for the shares for the date 2020. As can be seen, the shares of a cluster move together.
Figure (12) visualises the return within a cluster for the date 2020-02-01.
After creating clustering, we can use statistical techniques to identify stock pairs. The main idea of the theoretical underpinnings of a shared pair (stocks, bonds, foreign currencies, commodities, etc.) is very closely related to the concept of Cointegration in econometrics.
Co-integration was introduced (Engle & Granger, 1987). They show a different kind of dynamic co-movement, as it refers not only to movements in returns but also to movements in prices, exchange rates, and returns. The most important thing to understand is that the co-accumulation of pairs of shares can be suitable for trading pairs of shares. Engel and Granger say that if a linear combination of both time series is constant, although they may sometimes have imbalances, it can be said that the two series are also accumulated. Accumulation is presented in commodities or foreign currencies that are traded in multiple markets and for stocks that are listed on different cash and futures rates.
More precisely, two-time series and are said to be co-integrated if for some and . Here, the notation means ‘integrated of order d’.
Consider the following equation (4):
|
|
(4) |
where and are the prices of assets and in time t, respectively. The time frequency can be daily or intraday frequency (second, minute, hour, etc.). If , and are co-integrated, the spread is stationary—that is, . In this case, is the mean of the co-integration relationship, is the cointegration coefficient, and and form a pair (De Moura et al., 2016).
Pair trading strategy is one of the forms of statistical arbitrage that is done to make a profit and based on the return relates to the average spread between pairs of financial securities. Therefore, the first step in executing pair transactions is to select the appropriate shares for the pair. Using the coint test of the statsmodels.tsa.stattools package, identify 20 pairs of shares.
|
Table (3) Identify 20 pairs of shares |
||||||||||||||||||||||||||||||||||||||||
|
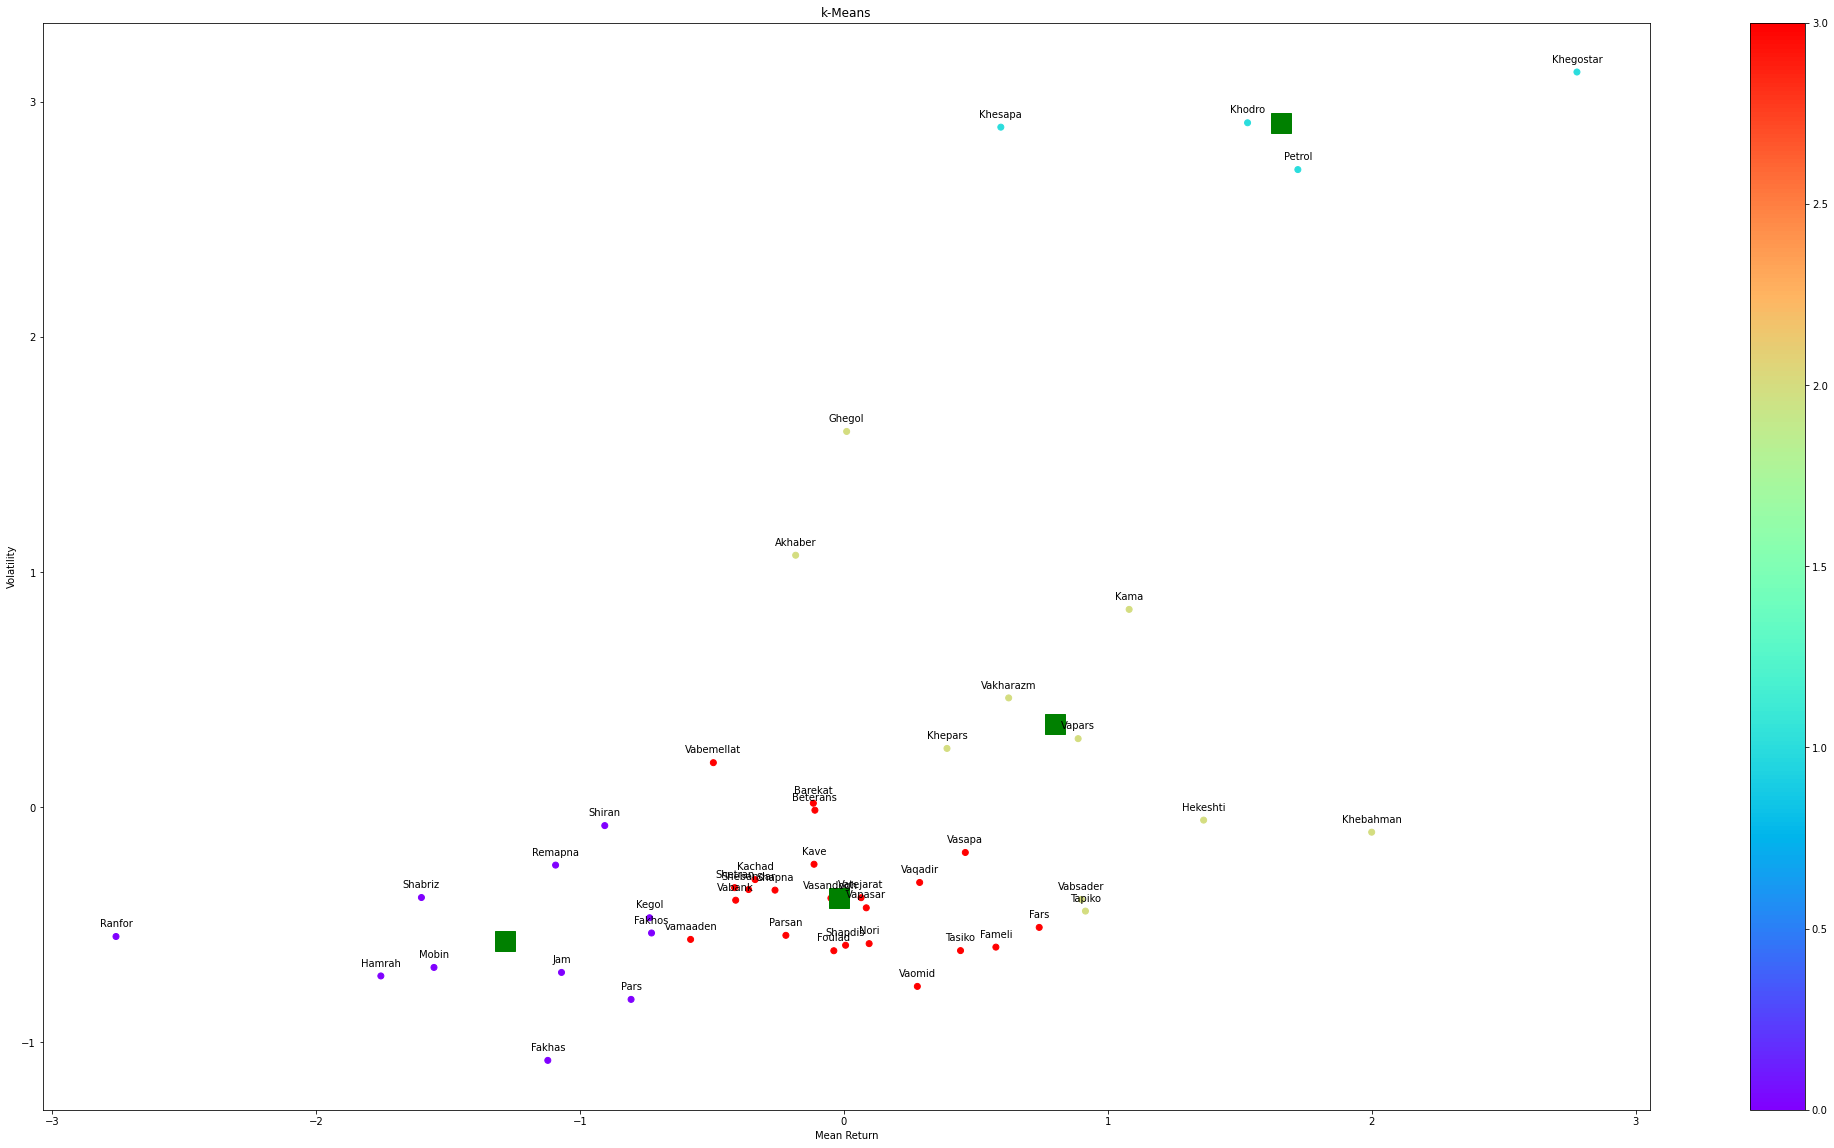
Then plot the results using the t-SNE method. After creating pairs of shares, they can be used in the pair trading strategy. Figure (13) shows Clustering by the t-SNE method.
|
|
|
Figure 13. Clustering by the t-SNE method |
Conclusion and Future Work
In recent years, the Clustering issue, discovery relationships, and also trends in time series, attracts researchers in various science fields, such as economic research. Time-series Clustering makes it possible to analyse large volumes of data at different time intervals (Chandra et al. 2008).
In general, Clustering is one of the data mining methods in which similar data are placed in related or homogeneous groups (Rai & Singh, 2010). Investors who intend to buy new stocks and add them to their portfolio, or investors who intend to form an optimal portfolio, first of all, they need to pay attention to the degree of co-movement, or the correlation between different stocks, because of this, Reducing the investor risk for risk aversion and increasing investor return for risky, so that they can use Clustering methods. The Clustering process involves segmenting N data into k groups or clusters. If we considered a set of data as , the most similar data to each other are classified in one cluster, and the less similar data are classified in other clusters. Depending on which Clustering method is used, the cluster's composition can be different (Ezugwu et al., 2020). In this study, using three methods of K-means, hierarchical clustering, and affinity propagation, we clustered stocks, and showed that stocks within a cluster move with each other; Therefore, people who intend to form a portfolio, by the principle of portfolio diversification and avoid the risks of related shares, should not select several shares from the shares in a cluster. Finally, by calculating the co-integration between the shares, pairs of shares that move with each other are identified using t-SNE to visualize these pairs of shares, obtained using the pair trading strategy.
Forming an investment portfolio is one of the main concerns of managers and investors who strive in order to form the best investment portfolio to get the best return from the market. So far, many methods have been presented to construct a portfolio of which the most famous is the Markowitz approach. In this study, we examined and evaluated different clustering methods using new Clustering methods. Researchers in future studies can use clustering results to create an optimal stock portfolio.
Another way to ensure well-constructed clusters is to use a distance threshold. Distance thresholds define the maximum distance within a cluster such that the components of a cluster are “similar” enough. Finally, we could improve the risk-adjusted return of the portfolio by weighting the individual stocks in the portfolio based on an optimization problem with maximizing the Sharpe ratio as a constraint.
Declaration of Conflicting Interests
The authors declared no potential conflicts of interest concerning the research, authorship and, or publication of this article.
Funding
The authors received no financial support for the research, authorship and, or publication of this article.